Excavator
294 models
Excavator
294 models  Backhoe Loader
51 models
Backhoe Loader
51 models  Crane
68 models
Crane
68 models  Concrete Mixer
79 models
Concrete Mixer
79 models  Wheel Loader
54 models
Wheel Loader
54 models  Compactor / Roller
45 models
Compactor / Roller
45 models  Motor Grader
42 models
Motor Grader
42 models  Concrete Pump
66 models
Concrete Pump
66 models  Skid Steer Loader
11 models
Skid Steer Loader
11 models  Telehandler
13 models
Telehandler
13 models  Dozer
Dozer 


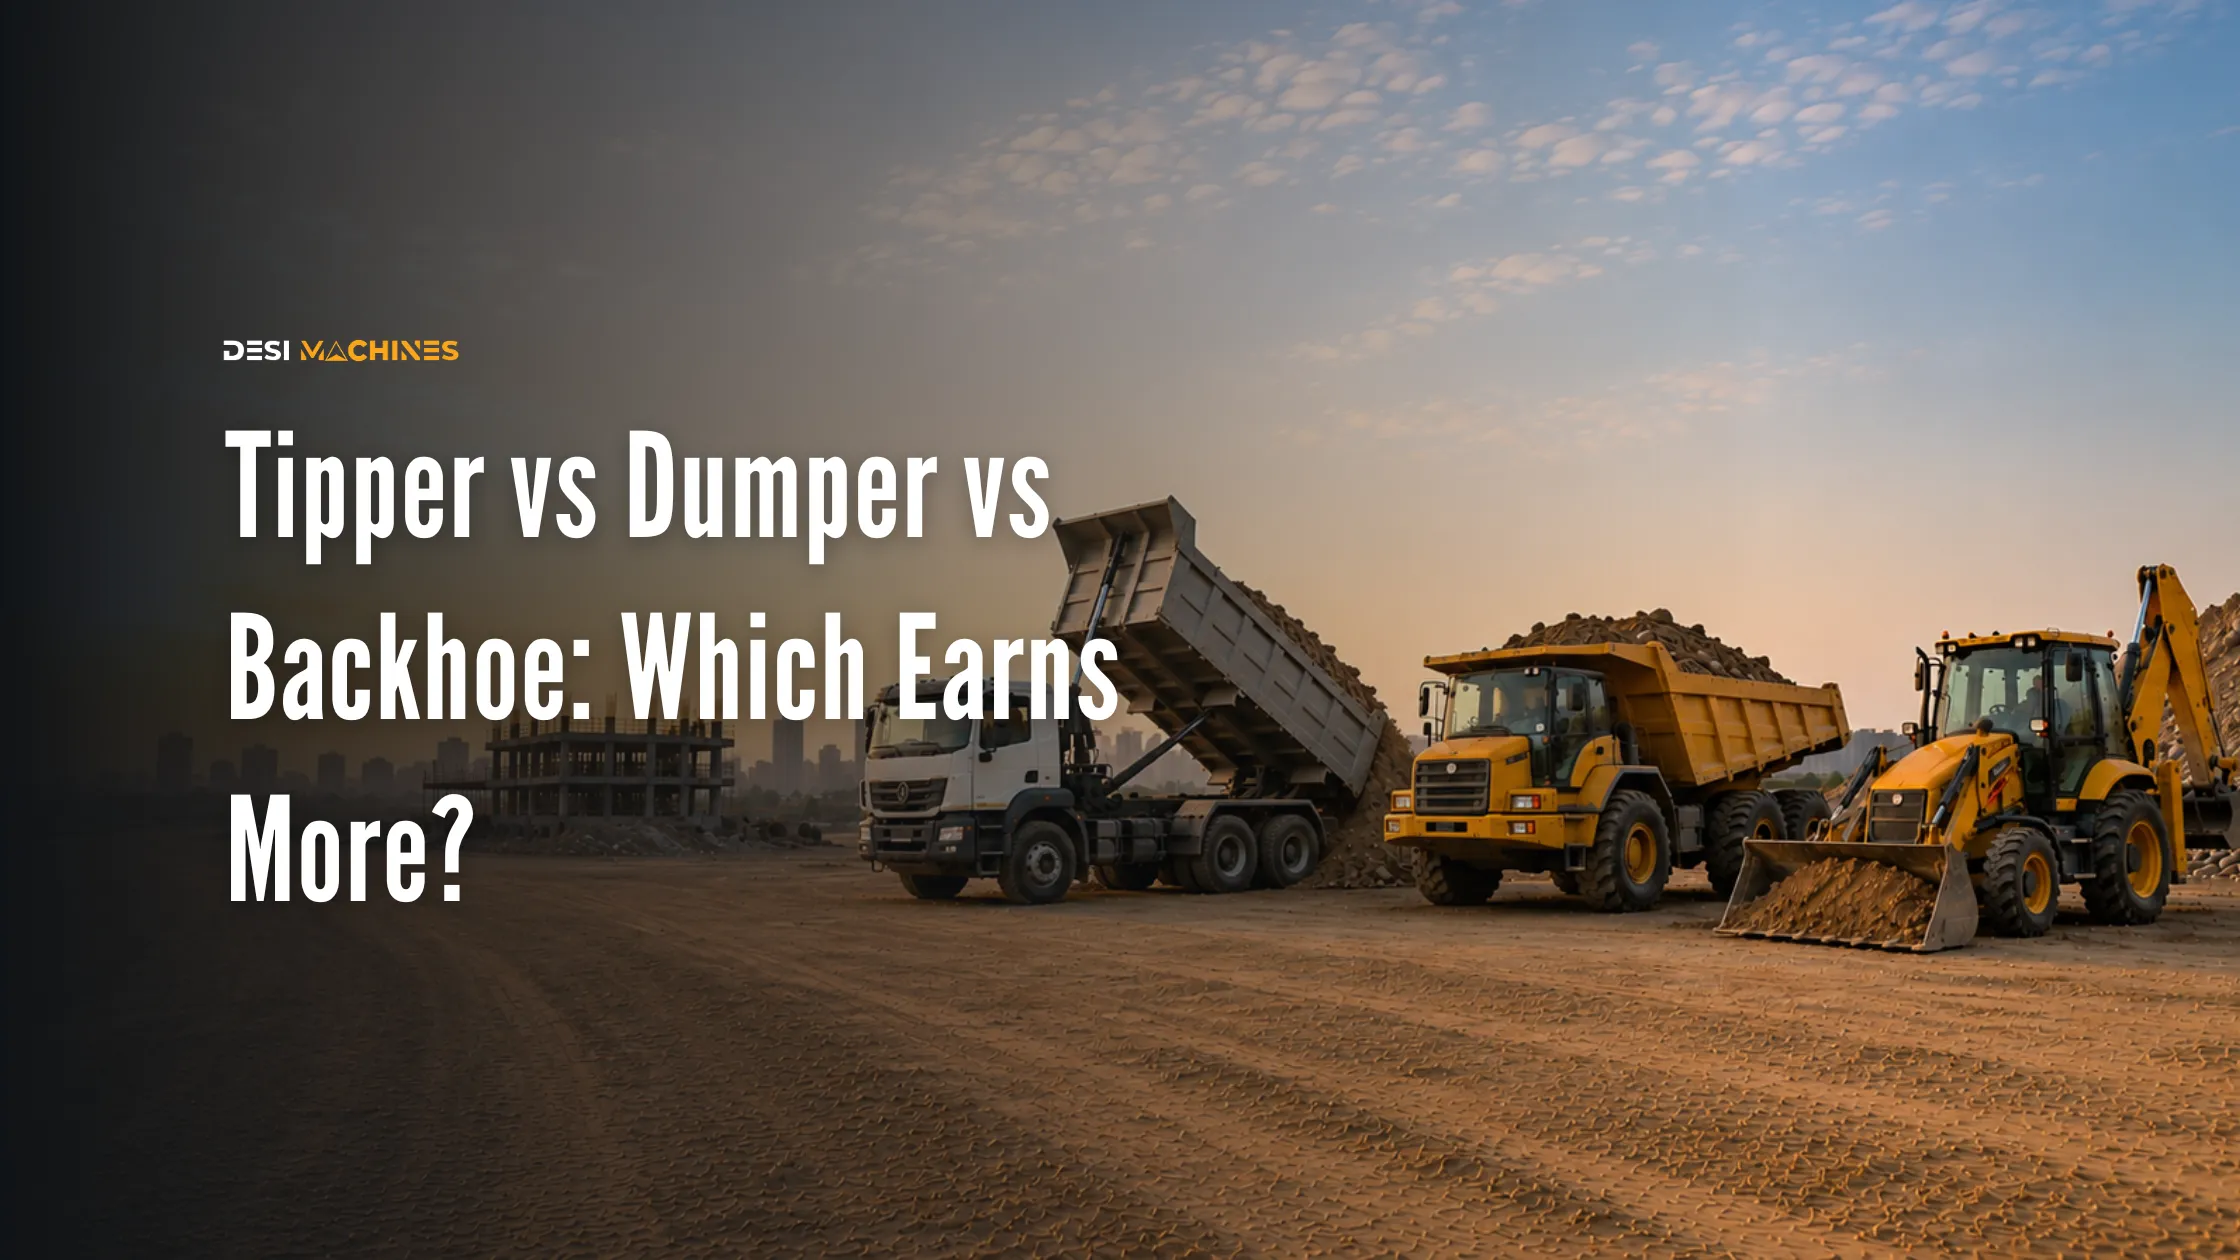
In short: There is no national dumper business profit per month figure, because a tipper earns per trip on a rate your local material market sets, while a backhoe or excavator earns per hour or per month on a hire rate. The comparison that settles it is monthly net divided by capital deployed. On our own numbers a financed backhoe on steady dry hire leaves roughly ₹35,000–90,000 a month (indicative, as of July 2026) before insurance and idle days — and that entire spread comes from utilisation, not from the choice of machine. Whichever asset you already have confirmed work for is the one that earns more.
Two owners in the same district put ₹30 lakh to work in the same month. One buys a backhoe loader, one buys a tipper. A year later one of them is comfortable and the other is refinancing. Ask either of them why, and you will get an answer about the machine. It is almost never about the machine.
This is the comparison people run entirely on the income side — what a tipper earns a trip, what a backhoe earns an hour — and almost never on the capital side or the risk side. Run all three and the question stops being “which asset earns more” and becomes something you can actually decide.
Dumper business profit per month: why there is no national number
Search for what a tipper or dumper earns and you will find confident monthly figures. Treat them the way you would treat a stranger quoting your own trade back to you.
A tipper’s income is a count of trips multiplied by a rate. The trips depend on a working loading point, a site willing to take the material, the length of the haul and the state of the road. The rate is set by the local market in sand, aggregate, soil or debris, and it moves with diesel and with the season. Two tippers of the same make, one running quarry aggregate on a 40 km haul and one running soil on a 6 km site shuttle, do not belong in the same sentence, let alone the same average.
A construction machine is different in a way that matters for planning. Backhoe and excavator hire is quoted in fairly stable local bands, per hour or per month, because the customer is buying capacity rather than a delivered tonne. Those bands are visible and reasonably consistent across the country, which is why the equipment rental rate card can publish them at all.
So the two assets are not equally forecastable. One has a published rate you can plan against. The other has a rate you must go and find, from two transporters actually running your route, before you build anything on it.
The three-line sum that actually compares them
Forget monthly earnings for a moment. The number that compares assets is what each rupee of your capital brings back every month.
Three lines, same for every asset:
Line 1 — Monthly revenue. For a machine: the hire rate times the hours or months you can realistically fill. For a tipper: trips a month times your local trip rate.
Line 2 — Monthly cost. EMI, diesel, driver or operator, maintenance provision, insurance, permits and your own overhead. Everything that leaves your account whether the asset worked or not goes here.
Line 3 — Capital deployed. Your down payment plus every rupee that went in before the asset earned anything, not the invoice value of the asset.
Then: (Line 1 minus Line 2) divided by Line 3. That is your monthly return on the money you actually put in, and it is comparable across a backhoe, a tipper, a mini excavator or a fixed deposit.
Most people compare Line 1 across assets and stop. That is how a business with a bigger topline and a worse return gets bought.
What the sum looks like on a backhoe
Take the case we can put real numbers against. A backhoe in the JCB 3DX class at an indicative ₹30–32 lakh (indicative, as of July 2026), bought with about ₹10 lakh down and a ₹20 lakh loan over five years.
| Monthly line (indicative, Jul 2026) | Amount |
|---|---|
| Dry-hire income, machine steadily deployed | ₹90,000–1,40,000 |
| Loan EMI (₹20 lakh, 12%, 5 years) | − ₹44,500 |
| Maintenance provision, insurance, overheads | − your own figures |
| Left before idle time and repairs | ≈ ₹35,000–90,000 |
The last line already carries an indicative ₹5,500–10,500 a month of maintenance provision, insurance and overheads: ₹90,000 of hire less the ₹44,500 EMI and the high end of that overhead leaves ₹35,000, and ₹1,40,000 less the EMI and the low end leaves ₹90,000. Put your own overhead figure in and the band moves with it.
Against roughly ₹10 lakh of capital in, the good end of that range is a strong monthly return and the bad end is ordinary. Same machine, same loan, same district. The full working, including where the money leaks, is in what one machine really earns.
Now run the same three lines on the tipper you are considering, with your own trip rate. If it does not beat the backhoe’s return on the same capital, the tipper is not the better business — it is the more familiar one.
That gives you the number to beat, and it is worth writing down before you talk to a seller. On the same ₹10 lakh of capital, the backhoe above is the benchmark:
| What your tipper has to clear to match | On ₹10 lakh capital in |
|---|---|
| Net a month, after EMI, diesel, driver and overheads | ₹35,000–90,000 |
| The same figure per working day (26 days) | ₹1,350–3,450 |
| Monthly return on the money you actually put in | 3.5%–9.0% |
These are the backhoe’s numbers restated, not a tipper forecast — we do not publish a trip rate, because there is no honest national one to publish. Take your own trips a month and your own local rate, run the three lines, and compare the answer against this column. A tipper clearing ₹20,000 a month net on the same ₹10 lakh is not a small win over the machine; it is half the return, and the gap compounds over a five-year hold.
Where the two businesses genuinely differ
The arithmetic is neutral. The structure is not, and these differences are what show up in a bad quarter.
| Factor | Tipper or dumper | Backhoe or excavator |
|---|---|---|
| How you bill | Per trip or per tonne-kilometre | Per hour, per day or per month on hire |
| Who sets the rate | The local material market and diesel | Local hire bands, fairly stable |
| Income shape | Many small jobs, spread risk | Often one customer a month, concentrated risk |
| Diesel behaviour | Burns on the empty return leg too | Burns only while working |
| Regulatory load | Permit, fitness, road tax, commercial licence, overloading exposure | Far lighter on a private site; permits apply when moving on road |
| Redeployment | Tied to material movement | Moves between earthwork, loading, trenching, handling |
The empty return leg deserves a second look, because it is the most commonly missed number in the tipper sum. Diesel is spent on every kilometre, and only half of them are carrying material. Any estimate built on the loaded distance alone understates fuel by roughly double.
On the machine side, the equivalent hidden line is idle time. A financed machine that stands still still costs you the EMI, the operator you cannot afford to lose and the overheads, which is why an idle day on a 20-tonne machine works out to an indicative ₹16,000–25,000. Spread over a slow month, that single line moves a good return to a poor one without a single breakdown.
The question that actually decides it
Before the asset class, answer this: what work have you already been offered, in writing or by someone who has paid you before?
If a contractor you have worked with wants a machine on monthly hire from next season, buy the machine. If a quarry or a builder you know is moving material and short of trucks, buy the tipper. If the answer is neither, and the plan is to buy first and find work after, then no comparison table helps, because both assets lose money standing still and the EMI does not care which one you picked.
Owners who start with confirmed work also start with a better loan. A lender looks harder at a first-time buyer with no contract than at one who can show where the machine is going, and the funding structure follows from that, as set out in what 90% funding really costs.
One more consideration for the longer view. Machines with a dense dealer and parts network hold their value better, and resale is a real part of the return on a five-year hold — the pattern is visible in which machines hold their resale value. The same is not automatically true of a tipper bought into a crowded local freight market.
One steady buyer of both machines is the aggregate trade, where a crusher plant needs stone hauled in and product hauled out all year. Before committing a tipper to it, read how the margins actually work in our piece on stone crusher business profit.
Where the steady work is
Both businesses live or die on utilisation, so it is worth knowing where the demand you can actually reach is coming from. Departmental and infrastructure work absorbs both machines and material movement, and it pays on a slower but more predictable calendar than private work does. If you are weighing an asset for the next three years, look at what is being tendered around you first, either through the live construction tenders and opportunities listings or through the process described in how to bid for government construction tenders.
Then price the operator or driver into the plan properly. An experienced backhoe hand costs an indicative ₹22,000–30,000 a month, and a good one pays for himself in fuel and machine care alone, as the numbers in the operator salary guide show.
The bottom line
There is no honest dumper business profit per month figure to quote you, and the backhoe number that we can quote — roughly ₹35,000–90,000 a month before insurance and idle days on a financed machine — has a spread wider than the difference between the two businesses. That spread is utilisation. Run the three-line sum on both assets with your own local rates, divide by the capital you are actually putting in, and buy the one you already have work for.
When you have the answer, compare what is currently listed across excavators and backhoe loaders, and check what you can borrow and at what rate on equipment finance before you commit to an EMI you have to feed every month.
Earnings, hire rates, trip rates, fuel prices and EMIs are indicative, vary by machine, location, season and date, and are taken from our listings and rate research at the time of writing. Confirm current prices and terms with the OEM, dealer, bank or insurer, and confirm local trip and hire rates with operators actually working your route, before deciding. DesiMachines is not liable for decisions taken on the basis of information that may have changed after publication.