Excavator
294 models
Excavator
294 models  Backhoe Loader
51 models
Backhoe Loader
51 models  Crane
68 models
Crane
68 models  Concrete Mixer
79 models
Concrete Mixer
79 models  Wheel Loader
54 models
Wheel Loader
54 models  Compactor / Roller
45 models
Compactor / Roller
45 models  Motor Grader
42 models
Motor Grader
42 models  Dozer
41 models
Dozer
41 models  Concrete Pump
66 models
Concrete Pump
66 models  Skid Steer Loader
11 models
Skid Steer Loader
11 models  Telehandler
13 models
Telehandler
13 models 


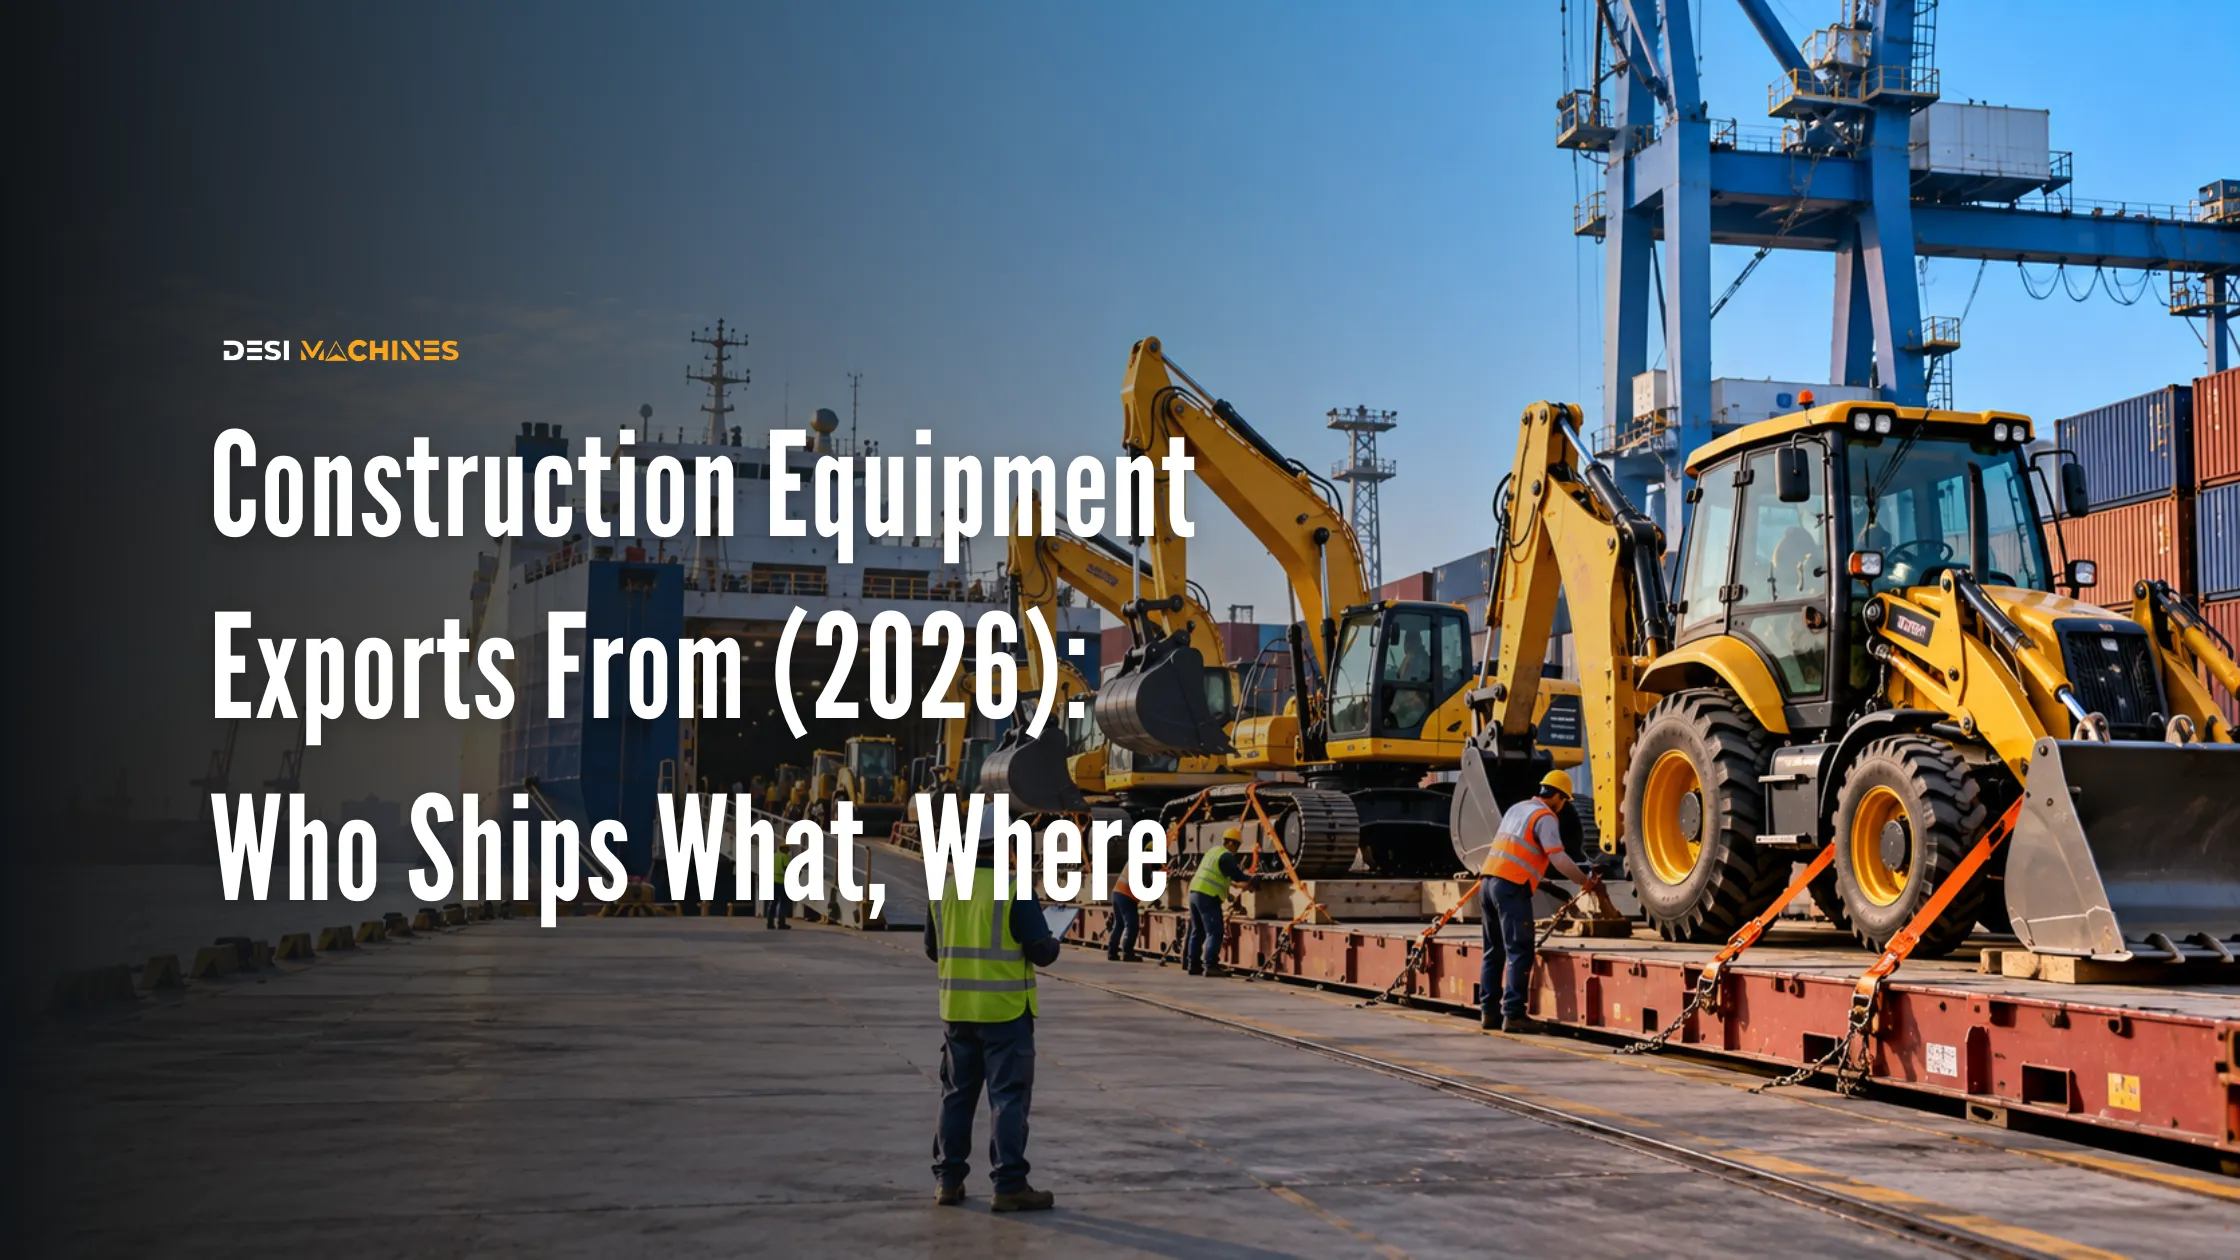
As of October 2026, the latest India construction equipment export data from the Department of Commerce shows USD 1,768.69 million of earthmoving machinery left the country in 2025-26 under HS heading 8429, up 22.94% on the year before, with the United Arab Emirates, the United States and South Africa the three largest buyers. Across the seven tariff headings that cover construction machinery and its parts, exports came to USD 4,970.93 million. The newer monthly figures, final to July 2026, show the run continuing: USD 674.90 million in the four months from April, up 23.11% year on year. Every figure here is dated and taken from the department’s own data bank.
None of this changes how an export sale actually works. If what you need is the mechanics, which code your machine falls under, which certificates a destination asks for and how a 20-tonne machine gets onto a ship, that is set out in the guide to how construction equipment export works from India. This page is the current scoreboard.
Where this India construction equipment export data comes from
Everything below is from the Export Import Data Bank run by the Department of Commerce, which publishes the Directorate General of Commercial Intelligence and Statistics returns by HS code, financial year and country. The Department of Commerce trade data bank is the primary record for Indian trade, and it is free to query.
Two release dates matter. The annual tables, which run from 2017-18 to 2025-26, were last updated on 7 August 2026. The monthly tables run from January 2018 to July 2026, are marked revised to March 2026 and final to July 2026, and were last updated on 16 September 2026. Where this page gives a four-month figure it comes from the monthly series; everything else is the full financial year.
Customs has no category called construction equipment, so the industry sits across several tariff headings. We have used seven of them and said so each time. Where a total is our own addition of the department’s published lines rather than a figure it publishes, that is flagged in the text. Nothing here is estimated, modelled or taken from a market-research report.
How much construction equipment does India export?
Heading 8429 is the one to watch. It covers self-propelled dozers, graders, levellers, scrapers, mechanical shovels, excavators, shovel loaders, tamping machines and road rollers, which is most of what the Indian industry builds in volume. In 2025-26 it came to USD 1,768.69 million, against USD 1,438.63 million the year before.
The eight years the data bank carries show how recent the change is. Exports fell in 2019-20, flattened through the pandemic year, then more than tripled from the 2018-19 base.
| Financial year | HS 8429 exports (USD million) | Change |
|---|---|---|
| 2018-19 | 551.72 | – |
| 2019-20 | 417.62 | -24.31% |
| 2020-21 | 484.60 | +16.04% |
| 2021-22 | 883.58 | +82.33% |
| 2022-23 | 1,006.05 | +13.86% |
| 2023-24 | 1,230.97 | +22.36% |
| 2024-25 | 1,438.63 | +16.87% |
| 2025-26 | 1,768.69 | +22.94% |
Source: Department of Commerce Export Import Data Bank, HS 8429, annual series last updated 7 August 2026. The percentages for 2020-21, 2022-23 and 2024-25 are our arithmetic on the department’s figures; the rest are as published.
Widen the lens to the seven headings that between them carry construction machinery and its parts and the 2025-26 total is USD 4,970.93 million, against USD 4,255.24 million in 2024-25. That addition is ours, not the department’s.
| Heading | What it covers | 2024-25 | 2025-26 | Change |
|---|---|---|---|---|
| 8429 | Excavators, loaders, dozers, graders, road rollers | 1,438.63 | 1,768.69 | +22.94% |
| 8431 | Parts for the machines of 8425 to 8430 | 1,376.77 | 1,507.50 | +9.50% |
| 8474 | Crushing, screening, washing and mixing plant | 797.61 | 953.44 | +19.54% |
| 8430 | Drilling, boring, pile driving, tunnelling machinery | 231.97 | 286.85 | +23.66% |
| 8705 | Special purpose vehicles, including transit mixers and crane lorries | 55.50 | 192.25 | +246.37% |
| 8427 | Fork-lift trucks and other works trucks | 246.83 | 142.99 | -42.07% |
| 8426 | Derricks and cranes of all kinds | 107.93 | 119.21 | +10.45% |
All figures USD million, from the Department of Commerce Export Import Data Bank, annual series last updated 7 August 2026. Percentage changes as published by the department.
Two of those lines deserve a second look. Special purpose vehicles more than tripled off a small base, which is one good year of transit mixer and crane lorry orders rather than a trend. Fork-lift trucks fell by more than 40%, which is the only heading in the group that went backwards. If you build or hire out handling equipment, that is the number to ask your dealer about.
Which machines does India actually ship?
Inside heading 8429 the six-digit subheadings tell you what is really moving, and the answer is excavators by a distance.
| Subheading | Tariff description | 2024-25 | 2025-26 |
|---|---|---|---|
| 8429.52 | Machinery with a 360 degree revolving superstructure (tracked excavators) | 604.10 | 721.83 |
| 8429.59 | Other mechanical shovels, excavators and shovel loaders (most backhoe loaders) | 450.73 | 572.86 |
| 8429.51 | Front-end shovel loaders | 229.98 | 283.22 |
| 8429.40 | Tamping machines and road rollers | 131.74 | 166.76 |
| 8429.20 | Graders and levellers | 15.24 | 12.84 |
| 8429.11 / 8429.19 | Track-laying and other dozers | 6.60 | 11.01 |
| 8429.30 | Scrapers | 0.23 | 0.17 |
USD million, from the same source at six-digit level for 2025-26, last updated 7 August 2026. The dozer line adds the department’s two published subheadings.
Three subheadings covering excavators, backhoe loaders and wheel loaders are 89% of the heading between them, on our arithmetic. That matches what the home market buys. Browse live excavator models and prices and backhoe loaders to see the same classes on sale here.
Outside 8429, two smaller lines grew fast in 2025-26: machines for mixing mineral substances with bitumen, which is asphalt plant, rose 69.74% to USD 50.68 million, and concrete and mortar mixers rose 31.80% to USD 56.13 million. Self-propelled boring and sinking machinery was up 52.60% to USD 139.88 million.
Which countries buy construction equipment from India?
The data bank publishes a full country table for every heading. For HS 8429 in 2025-26 it names more than 150 destinations, and the ten largest took 54% of the value, again on our arithmetic.
| Destination | 2024-25 | 2025-26 |
|---|---|---|
| United Arab Emirates | 137.31 | 182.26 |
| United States | 132.05 | 177.61 |
| South Africa | 98.39 | 132.20 |
| Saudi Arabia | 105.68 | 86.70 |
| Mexico | 86.70 | 83.93 |
| Algeria | 31.92 | 65.60 |
| Ghana | 197.27 | 64.94 |
| Nepal | 33.95 | 60.14 |
| Sierra Leone | 9.64 | 54.34 |
| Brazil | 57.44 | 46.88 |
USD million, ordered by the 2025-26 figure, from the Department of Commerce HS 8429 country table, last updated 7 August 2026.
Six of those ten are in Africa or West Asia, which is the shape of the trade rather than an accident of one year. The outlier is Ghana, which fell from USD 197.27 million to USD 64.94 million and had been the single largest destination the year before. Sierra Leone went the other way, from USD 9.64 million to USD 54.34 million. Single mining or road programmes move these numbers, so a country can lead the table one year and halve the next.
What the months to July 2026 show
The monthly series is more current and tells a slightly different story about who is buying. For HS 8429, April to July 2026 came to USD 674.90 million against USD 548.20 million in the same four months of 2025, up 23.11%. July 2026 alone was USD 194.97 million against USD 134.12 million, up 45.37%.
| Destination | Apr-Jul 2025 | Apr-Jul 2026 |
|---|---|---|
| United States | 59.55 | 65.07 |
| South Africa | 41.30 | 60.15 |
| United Arab Emirates | 55.12 | 42.26 |
| Saudi Arabia | 33.80 | 39.32 |
| Mexico | 22.20 | 37.38 |
| Ghana | 46.38 | 37.16 |
| Oman | 3.47 | 31.16 |
| Kenya | 6.35 | 21.33 |
| Netherlands | 9.40 | 21.13 |
| Tanzania | 10.70 | 20.10 |
Figures in USD million, from the department’s monthly series for HS 8429, marked final and last updated 16 September 2026.
Oman went from almost nothing to USD 31.16 million in four months and Kenya more than tripled. Four months is a short window and one large consignment can carry a country up the table, so treat these as the direction of travel rather than a settled ranking.
Parts are nearly as big as whole machines
The quietest number on this page is heading 8431, parts for the machines of headings 8425 to 8430, at USD 1,507.50 million in 2025-26. That is 85% of the value of every complete machine shipped under 8429, and it grew 9.50%.
Parts of crushing and screening plant, under 8474.90, add another USD 558.46 million. Put the two together and components are a larger export business than finished earthmoving machines, which is the part of the story that rarely makes a headline. The Indian supply base behind it is covered in the guide to hydraulic cylinder, pump and hose manufacturers in India, and the manufacturing build-out that created it in the guide to Make in India and construction equipment manufacturing.
The bottom line
On the Department of Commerce figures to 31 March 2026, India exported USD 1,768.69 million of earthmoving machinery and USD 4,970.93 million across the seven headings that cover construction equipment and its parts. The buyers are concentrated in West Asia, Africa and the Americas, excavators carry most of the value, and the four months to July 2026 are running 23% ahead of last year. What the data will not tell you is which Indian plant built any given machine, because trade statistics record the code and the port, not the brand.
If you are buying here rather than shipping abroad, the practical read is that the lines building these machines are the same ones filling Indian orders. Compare live excavators, soil compactors and cranes and connect with a dealer, or start from the complete guide to heavy equipment in India.
Trade figures change with every release and are revised. All data on this page is from the Department of Commerce Export Import Data Bank, with annual tables last updated 7 August 2026 and monthly tables 16 September 2026; totals and percentages identified as ours are arithmetic on the department’s published lines. Confirm the current position on the data bank, or with your customs broker or dealer, before relying on any of it for a bid or a purchase decision.